
CartaVue™ Connects You with Geospatial Data
As a global provider of premium commercial geospatial data, CartaVue enables Visualization & Simulation (VisSim), Mapping, and Analytic solutions across Defense, Infrastructure, Energy, Environmental, and Public Safety sectors.
From foundational basemaps to advanced simulation environments, we provide trusted Satellite, Aerial, Elevation, Radar, Spectral, LiDAR, 3D, and other commercial datasets from leading earth observation sources worldwide; reducing complexity, accelerating execution, and strengthening outcomes.
With decades of experience, we curate tailored, mission‑ready data packages aligned to your requirements, timelines, standards, and budgets. Our role is strategic: to Source, Align, and Deliver high‑quality data that supports accurate Modeling, Operational planning, and informed Decision‑making.
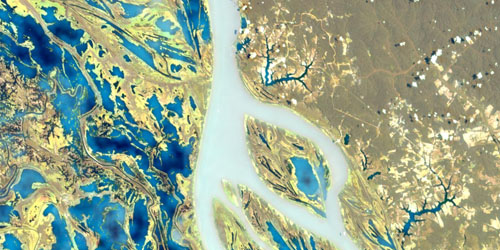
Satellite Imagery
Satellite imagery provides consistent, scalable observation of the Earth’s surface using sensors that collect reflected or emitted energy across visible, infrared, and other spectral bands. Imagery resolution ranges from 30cm to 30m GSD globally, to 15cm GSD regionally.
These space-based systems support systematic monitoring, mapping, and analytic workflows by delivering repeatable coverage, standardized data formats, and predictable revisit cycles. Satellite imagery serves as a foundational input for a wide range of geospatial products - enabling feature extraction, land-use classification, material classification, environmental assessment, and temporal analysis across local, regional, and global scales.
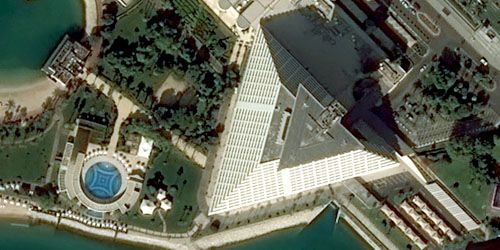
High-Resolution Satellite Imagery
High-resolution satellite imagery (30cm to 50cm) provides sub-meter visual detail, enabling the interpretation of roads, facilities, structures, and other small-scale features that are essential for engineering, planning, and monitoring workflows. These datasets come from commercial optical satellites capable of capturing fine spatial detail across large areas, with both extensive historical archives and flexible tasking options. This makes them particularly useful for applications that require recent, consistent, and highly detailed visual evidence. 15cm HD imagery is available regionally.
Source / Inputs:
- Commercial submeter satellite collections available via archive or tasking.
Key Features:
- Object-level clarity
- Global coverage and deep archives
- Flexible acquisition windows
Common Uses:
- Visualization and Simulation
- Infrastructure inspections
- Engineering basemaps
- Change detection
- Emergency response
Choose this when…
- Your workflow requires fine-detail visibility of manmade features.
- You need submeter accuracy for assessment or simulation.
Medium-Resolution Satellite Imagery
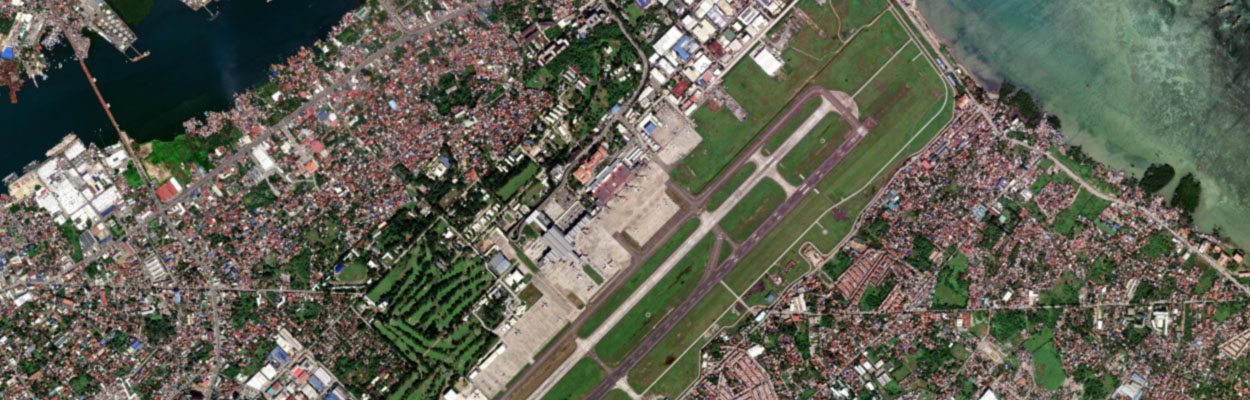
Medium-resolution satellite imagery (1m–5m) delivers a balance of spatial detail and broad coverage, making it ideal for regional monitoring and environmental analysis. The constellation-based nature of these systems enables frequent revisits and long historical archives, supporting reliable multi-year analyses and change-monitoring initiatives. This resolution tier is well suited for identifying patterns in vegetation, land cover, land management practices, and surface conditions.
Source / Inputs:
- Large-swath multispectral constellations with frequent revisits.
Key Features:
- Regional coverage
- Frequent temporal refresh
- Long historical availability
Common Uses:
- Visualization and Simulation
- Agriculture
- Forestry
- Land-use/land-cover monitoring
- Environmental analysis
Choose this when…
- You need regional-scale insights or multi-temporal studies.
- Submeter detail is unnecessary for your mission.
Low-Resolution Satellite Imagery
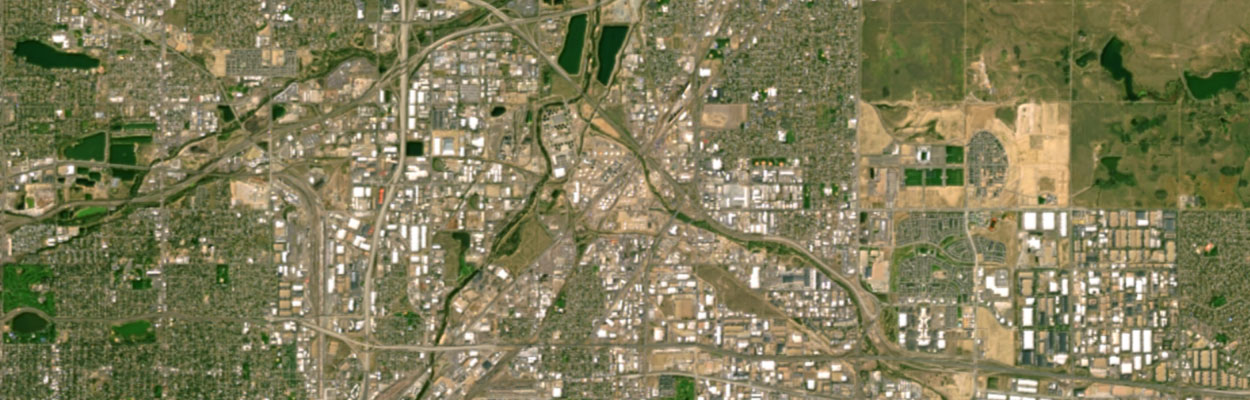
Low-resolution (10-15m) satellite imagery prioritizes global coverage and temporal frequency, allowing analysts to observe large-scale phenomena, environmental patterns, and long-term change. These missions emphasize consistency and continuity, producing time-series datasets used for climate research, environmental monitoring, and planetary-scale analysis. Though not designed for fine detail, these datasets offer unparalleled spatial breadth.
Source / Inputs:
- Global sensors optimized for environmental screening and repeat observation.
Key Features:
- Visualization and Simulation
- Wide coverage
- High temporal continuity
- Consistent long-term datasets
Common Uses:
- Vegetation indices
- Climate monitoring
- Land-cover trends
- Global situational awareness
Choose this when…
- You require macroscale insight rather than fine-feature mapping.
- Cost-efficient broad coverage is the priority.
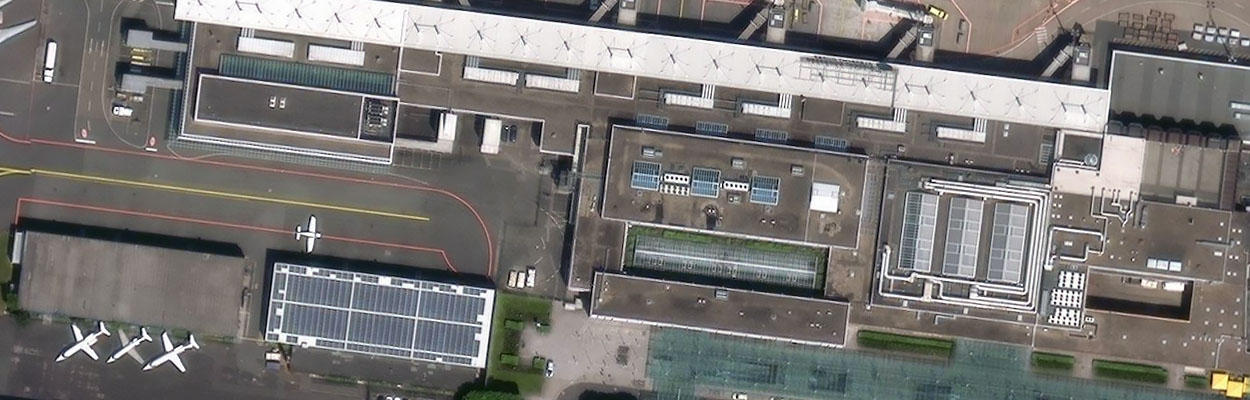
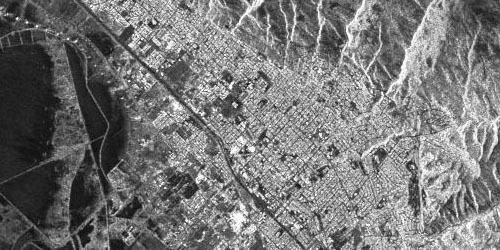
Aerial Imagery
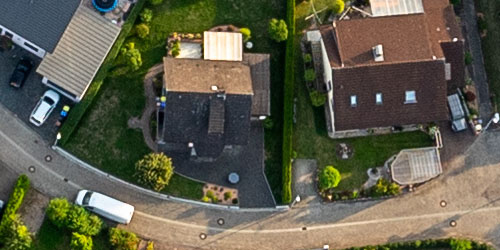
Aerial imagery offers sub-decimeter spatial detail (starting at 7.5cm), enabling precise visualization of buildings, roads, vegetation, and other local-scale features. Aerial programs typically provide standardized capture specifications and predictable refresh cycles, making them ideal for enterprises that rely on consistent, high-resolution basemaps.
Many programs also include true-orthos, which correct for building lean, and oblique imagery to support detailed interpretation from multiple viewpoints.
These aerial datasets also offer enhanced geometric accuracy through direct georeferencing and multi-angle acquisition, enabling measurement-grade workflows for assessment, planning, and inspection. Because they support oblique and multispectral capture, aerial programs provide completeness and context that enrich 3D modeling, vegetation analysis, and structural interpretation. Their clarity and precision make them the preferred choice for urban and utility-focused workflows requiring the highest level of spatial fidelity.
Source / Inputs:
- Airborne sensors with GPS/IMU
- National/regional wide-area programs
- Multi-angle capture collections
Key Features:
- High spatial detail
- True-orthos with minimized lean
- Obliques for building façades and 3D context
- Reliable refresh cycles for urban coverage
Common Uses:
- Visualization and Simulation
- Urban planning
- Property assessment
- Infrastructure mapping
- Vegetation review
- Measurement workflows
Choose this when…
- You need measurement-grade spatial accuracy.
- True-orthos or oblique imagery are required for operational modeling.
Digital Elevation Models
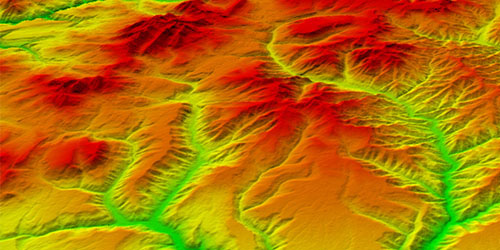
Digital Elevation Models represent the vertical structure of the Earth’s surface, with DTMs modeling bare‑earth terrain and DSMs capturing buildings, trees, and other surface elements.
These datasets vary in spatial detail depending on scale, with elevation post‑spacing of 50cm at the local level, 2m–15m for regional datasets, and 30m globally. Such resolution differences influence how DEMs support terrain analysis, hydrologic modeling, infrastructure planning, and environmental assessment. Because elevation strongly affects water flow, line‑of‑sight, shading, and slope, DEMs form a foundational layer in most analytical workflows.
Elevation datasets come from a range of sources—photogrammetry, LiDAR, radar—and span multiple resolutions, allowing users to match data density to project needs. High-resolution DSMs support obstruction and visibility analysis in built environments, while coarser DTMs remain useful for broad terrain modeling and large regional assessments. Together, they create a comprehensive vertical representation essential for simulation, planning, and geospatial decision support.
Source / Inputs:
- Photogrammetric DEMs
- LiDAR datasets
- Satellite-derived elevations across a range of resolutions
Key Features:
- DTMs for topography-only representations
- DSMs for built-environment and canopy surfaces
- Multi-resolution availability
Common Uses:
- Hydrologic modeling
- Slope/terrain metrics
- Viewshed and line-of-sight analysis
- Volumetrics
- Orthorectification
Choose this when…
- Select DTM for ground-based modeling.
- Select DSM for visibility, obstruction modeling, and urban form analysis.
Vector Data
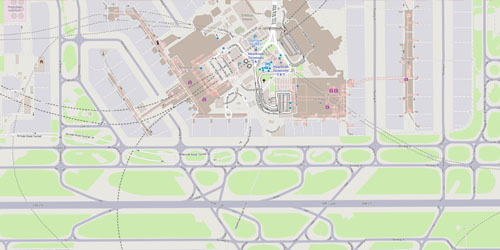
Vector datasets provide structured geometric representations of real-world features such as road networks, hydrography, land-use classes, aerodrome layouts, and administrative boundaries. Unlike raster imagery, vector layers encode semantic relationships and attributes, making them central to spatial analysis, routing, modeling, and regulatory assessment.
These datasets form the skeleton of many GIS workflows, offering precise geometry, efficient storage, and interoperability across software platforms. Their thematic richness allows users to layer, filter, and analyze geographic information in highly customizable ways. Vectors also integrate seamlessly with imagery and elevation models to create richer analytics, simulations, and cartographic products.
Source / Inputs:
- Imagery-derived geospatial line/polygon/point datasets
- Land-use classifications
- Aerodrome mapping content
Key Features:
- Attribute-rich, analysis-ready
- Standards-aligned geometries
- Lightweight and efficient
Common Uses:
- Routing
- Site planning
- Regulatory overlays
- Thematic mapping
- Environmental analysis
Choose this when…
- You require structured geometry rather than imagery pixels for analysis or modeling.
3D Models
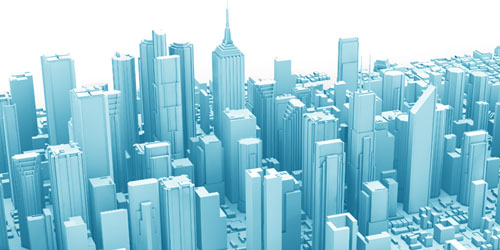
3D city and building models provide three-dimensional representations of structures, terrain, and urban form, enabling realistic planning, simulation, visualization, and analytical workflows. Depending on the application, these models may be photorealistic meshes, simplified block models, or precisely defined building geometry with multiple levels of detail (LOD).
Such models are widely used for flight simulation, emergency response planning, architectural previsualization, and digital twin ecosystems. Their inclusion of height, volume, and façade information allows for accurate modeling of shadows, line-of-sight, wind corridors, and other vertical phenomena not captured by 2D data. Because they integrate seamlessly with elevation and imagery inputs, 3D models serve as a foundational layer in immersive and predictive urban workflows.
Source / Inputs:
- Imagery-derived meshes
- Elevation sources
- Automated building extraction workflows
Key Features:
- Multiple levels of detail (LOD)
- Photorealistic or simplified options
- Compatible with simulation and planning systems
Common Uses:
- Urban design
- Emergency planning
- Line-of-sight modeling
- Training simulations
Choose this when…
- You need vertical environment context, 3D visibility, or immersive simulation content.
Synthetic Aperture Radar (SAR) Data
Synthetic Aperture Radar is an active sensing technique that uses microwave signals to generate imagery independent of sunlight or atmospheric conditions. Because it transmits its own energy, SAR can operate consistently through clouds, haze, and darkness, providing dependable observations when optical data may be limited or unavailable.
SAR measurements are sensitive to surface structure, moisture, and geometry, allowing users to detect differences in texture, form, and physical change. Various acquisition configurations support different balances of spatial detail and coverage, enabling both broad-area monitoring and focused analysis. SAR data can be processed into a range of derived products that highlight surface characteristics, temporal variation, and change over time, supporting applications that benefit from stable, repeatable measurements of the Earth’s surface.
Source / Inputs:
- Spaceborne radar systems that provide calibrated SAR imagery
- Multiple acquisition configurations and processing levels
Key Features:
- Cloud-immune
- Night-capable
- Multiple imaging modes
Common Uses:
- Flood mapping
- Infrastructure monitoring
- Deformation
- Surveillance
Notable Options:
- Complex (SLC) products
- Detected (GRD/orthorectified) products for analytics and GIS
Choose this when…
- You need persistent monitoring despite weather or lighting.
- You require robust surface change detection.
Light Detection and Ranging (LiDAR) Data
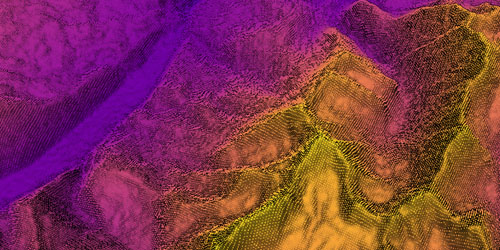
LiDAR is an active sensing technique that uses laser pulses to measure the three‑dimensional structure of the Earth’s surface. By recording the time it takes for emitted light to return from the ground and other features, LiDAR produces dense point clouds that represent terrain, vegetation, and built structures with high geometric fidelity. These point clouds can be transformed into a variety of elevation and surface models depending on the analytical needs.
LiDAR is commonly collected from airborne platforms using laser scanners paired with positioning and orientation systems. The resulting measurements capture millions of individual returns that, when combined, form a detailed 3D representation of the landscape. Depending on collection density and processing approaches, LiDAR can support broad‑area mapping or highly detailed modeling of smaller sites. Point clouds often undergo classification, filtering, and surface modeling to create refined datasets suitable for analysis, visualization, or integration with other geospatial information.
Source / Inputs:
- Airborne laser-scanning systems
- Terrestrial laser-scanning systems
- Mobile laser-scanning systems that generate active 3D measurements
Key Features:
- High geometric accuracy
- Multiple return capability
- Flexible density
- Versatile derivatives — supports creation of digital surface models, bare‑earth terrain models, canopy metrics, structural analyses, and other specialized products.
Common Uses:
- 3D mapping and visualization
- Terrain modeling
- Vegetation and forestry analysis
- Infrastructure and asset assessment
- Hazard and risk studies
Notable Options:
- Airborne LiDAR for broad coverage and flexible density for regional to local mapping
Choose This When…
- You need accurate 3D representations of terrain, vegetation, or built structures.
- Your project requires precise elevation data for modeling, design, or analysis.
- You need to distinguish between surface features and bare earth.
- Consistent, high‑resolution structural information is more important than spectral or textural detail.
Hyperspectral Imagery
Hyperspectral imagery measures reflected energy across a large number of narrow, continuous spectral bands, creating detailed spectral profiles for each pixel. This dense spectral information supports the differentiation of materials and surface conditions that are not easily distinguished using broader-band imaging approaches.
Hyperspectral datasets typically include radiance or reflectance values organized as multi-band data cubes. Their fine spectral sampling enables the extraction of diagnostic spectral features, supporting a wide range of analytical tasks such as identifying material characteristics, distinguishing subtle surface variations, and performing advanced modeling or classification. These data are used across many scientific, monitoring, and analytical workflows where detailed spectral information is beneficial.
Source / Inputs:
- Imaging spectrometers that provide radiance or reflectance data cubes
- Standard calibrated and analysis-ready formats
Key Features:
- Continuous spectral signatures
- High spectral resolution for material identification
- Supports geochemical and biophysical parameter retrieval
Common Uses:
- Vegetation biochemistry (chlorophyll, nitrogen, water)
- Mineral mapping
- Soil characterization
- Water quality
- Environmental hazard analysis
Choose this when…
- You require material-level or spectrally diagnostic insights.
- Your analysis depends on spectral continuity across hundreds of bands.